Type
Oscillator
Short introduction
James Sibbet developed this indicator. It combines prices with volume. Sibbet has established trading rules for the Demand Index:
-
A divergence between the indicator and the underlying stock points to imminent price weakness.
-
A high in the indicator is often followed by an upward trend with new highs in the underlying stock.
-
Rising prices accompanied by a lower demand index indicate a turning point in the underlying.
-
An intersection of the midpoint line indicates a change in trend.
-
If the Demand Index is quoted around its midpoint, no new, longer-term trend is to be expected.
-
Large, long-lasting divergences between the underlying stock and the indicator point to a price reversal.
Formula/calculation
Scholars argue a little about the exact calculation, also in view of the fact that no clear definition of sibbet can be found in the literature. According to Thomas E. Aspray, the Demand Index is the ratio of the so-called Buying Pressure (BP) and Selling Pressure (SP). Buying pressure and selling pressure are defined by a specific weighting of the volume, which depends on the size of the price movement and the position of the close in an average multi-period range:
For rising prices:
BP = V
SP = V / Weight
For falling prices:
BP = V / Weight
SP = V
The ratio of BP and SP is usually plotted in a range from -100 to +100, so that there is a balanced ratio at the center point 0. The index assumes negative values if SP predominates. -50 means double selling pressure and the extreme value -100 means exclusive selling pressure. Accordingly, buying pressure predominates with positive index values, e.g. +25 stands for a ratio of 4:3 and +75 for fourfold buying pressure.
Statement/Interpretation
The following literature is recommended for the statement and interpretation of the Demand Index:
-
Müller, Thomas and Lindner, Wolfgang: The big book of technical indicators, TM Börsenverlag
-
Achelis, Steven B.: Technical Analysis from A to Z
-
Colby, Robert W. and Meyers, Thomas A.: The Encyclopedia of Technical Market Indicators
-
Pring, Martin: Martin Pring on Market Momentum
Default setting
-
Period 10
Basic trading systems
-
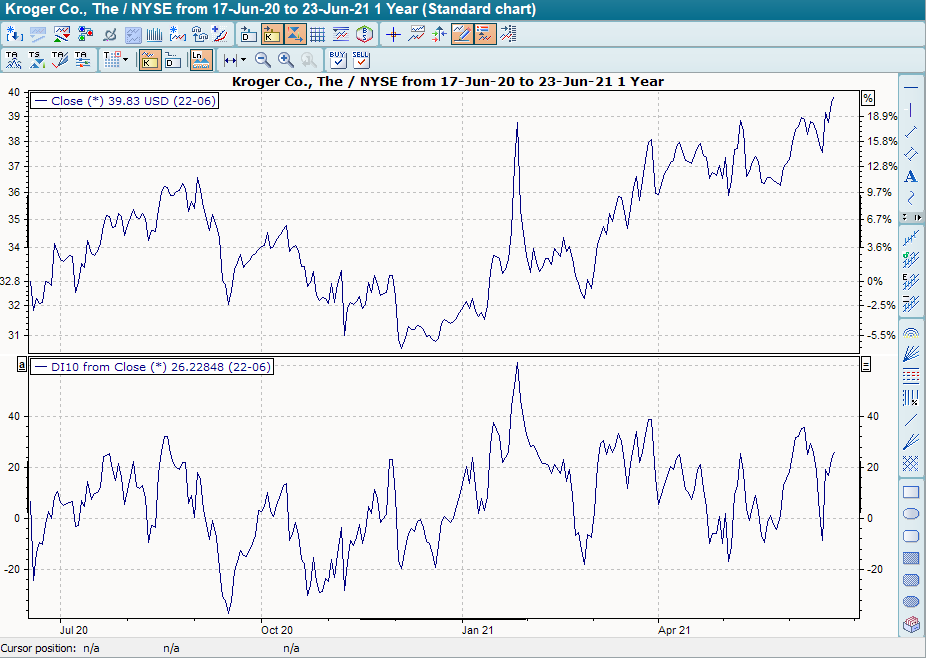
Demand Index
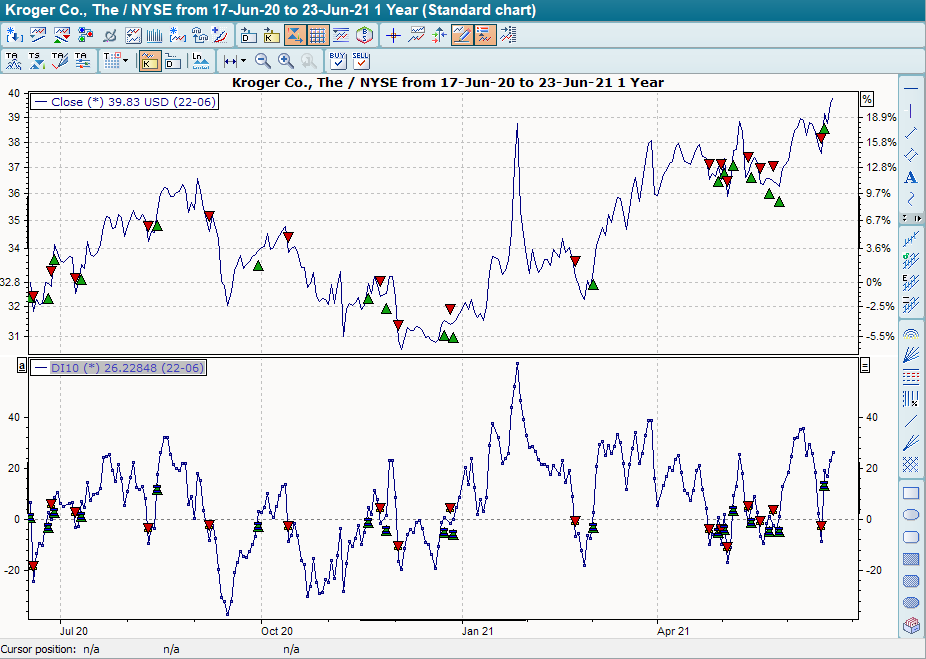
The base trading system "Demand Index" has a default setting of 10. The zero line is also shown. The base trading system provides buy signals when the indicator crosses the zero line from bottom to top and sell signals when the indicator crosses the zero line from top to bottom.
Related indicators
-
None