Module "Advanced Technical Analysis"
The following symbols are used in the formation chart to evaluate the security:
|
Element |
Icon |
Description |
|---|---|---|
|
Buy signal |
|
An upward-pointing green triangle symbolizes a buy signal. |
|
Sell signal |
|
A red triangle pointing downwards symbolizes a sell signal. |
|
Date of analysis |
|
The "TA" flag marks the analysis date (the current date by default). You can change the analysis date by clicking on the DATE command in the context menu of the flag and selecting a new date from the calendar. You can hide all signals by clicking on the REMOVE command in the context menu of the flag. |
|
Trend signals |
|
The flag "TS" symbolizes the representation of trend signals in the price development. You can hide all signals by clicking on the REMOVE command in the context menu of the flag. |


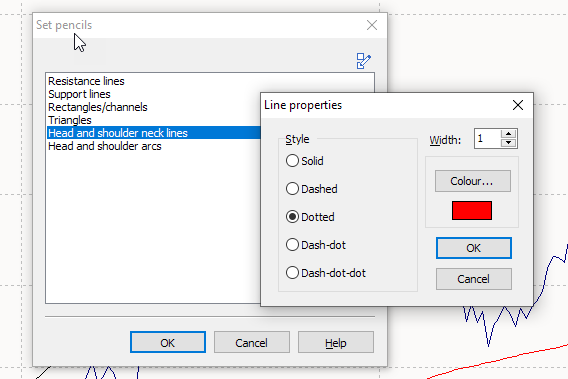
You can change the color and style for each formation using the "Set drawing pens" icon.
-

-

-
Select a different color or a different line type with a mouse click and confirm with "OK".