Report PAI analysis
The standard report "Report PAI Analysis" provides you with the perfect basis for your sustainability reporting.
In order to use the report effectively, the corresponding PAI data subscription must be activated.
You can find the "PAI analysis report" in the workspaces of portfolios, owners and groups, for example, under the "Reporting", "ESG" worksheets. In the "Open template" dialog box, the report is sorted in the "Compliance" category.
The report consists of several parts, which are described in more detail below and can be customized.
Components of the "Report PAI analysis"
Table 1 - Explanation of the main adverse impacts on sustainability
In the first part of the report, you will first see the financial market participant, which you configure using the parameter of the same name. Enter the official name of your company and - if available - the LEI, for example.
This is followed by a summary in accordance with Article 5 DelVO (Delegated Regulation). This text field is empty by default; you must integrate your individual description here.
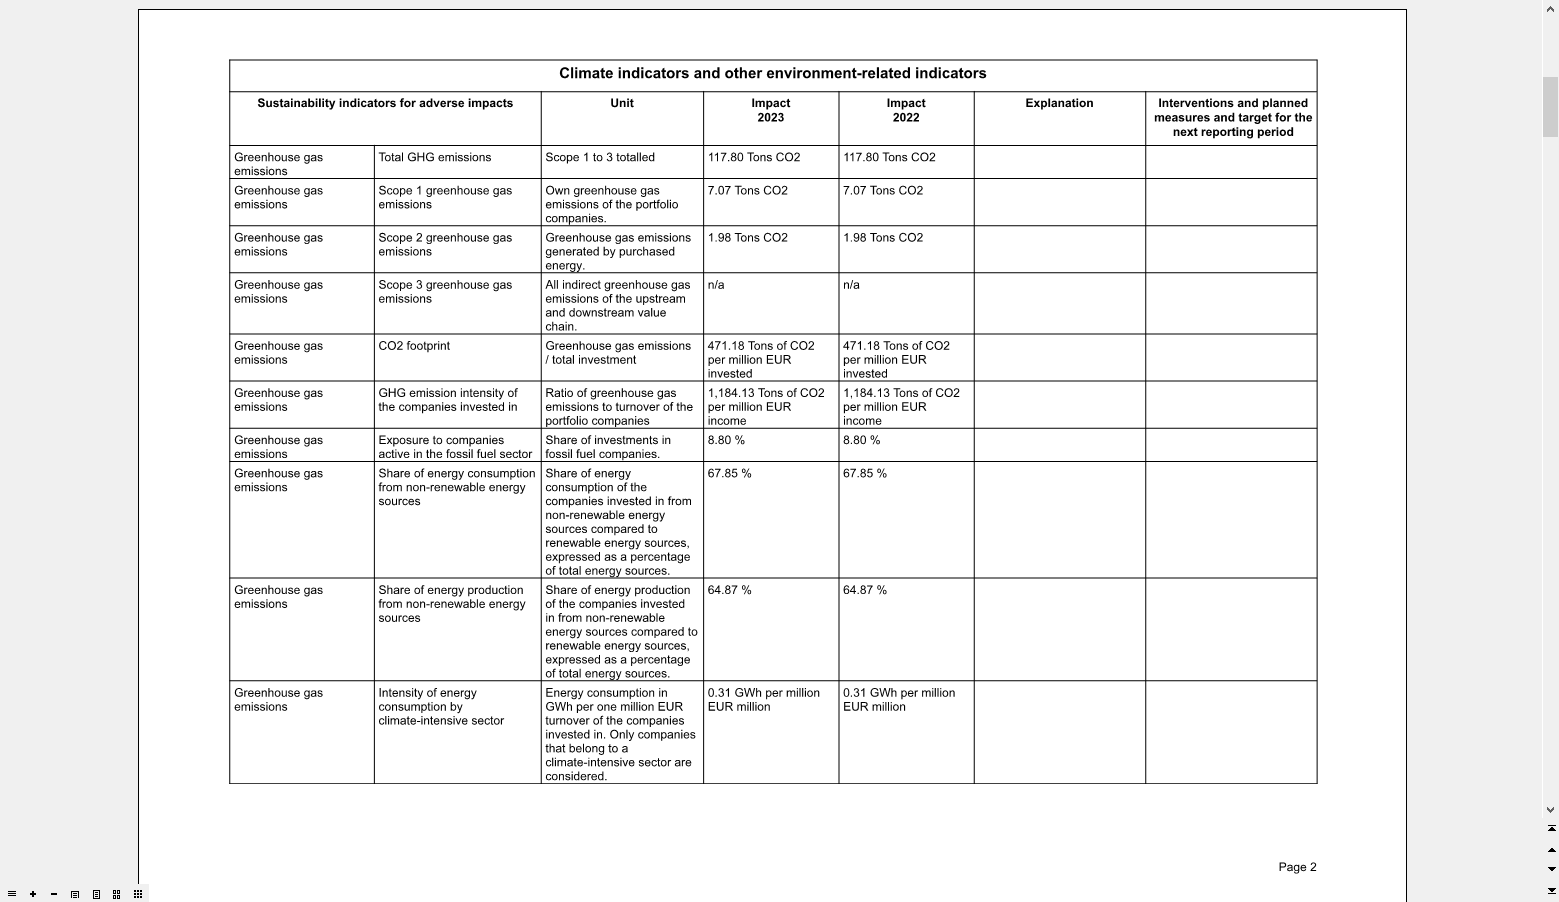
Next are the tables listed here with the mandatory sustainability indicators:
- Climate indicators and other environmental indicators
- Indicators in the areas of social affairs and employment, respect for human rights and combating corruption and bribery
- Indicators for investments in states and supranational organizations
You will then find the overviews of further optional indicators for the most important adverse impacts on sustainability factors.
These are divided into the following areas:
- Information on the main adverse impacts on sustainability factors in accordance with Article 6(1)(a) (based on the model in Table 2)
The indicators listed here can also be found in the following Table 2 "Additional climate and other environment-related indicators". You can show and hide the indicators using the T2 parameters of the report . Please note that you must list at least one of the indicators available here. - Information on the main adverse impacts on sustainability factors in accordance with Article 6(1)(b) (based on the template in Table 3)
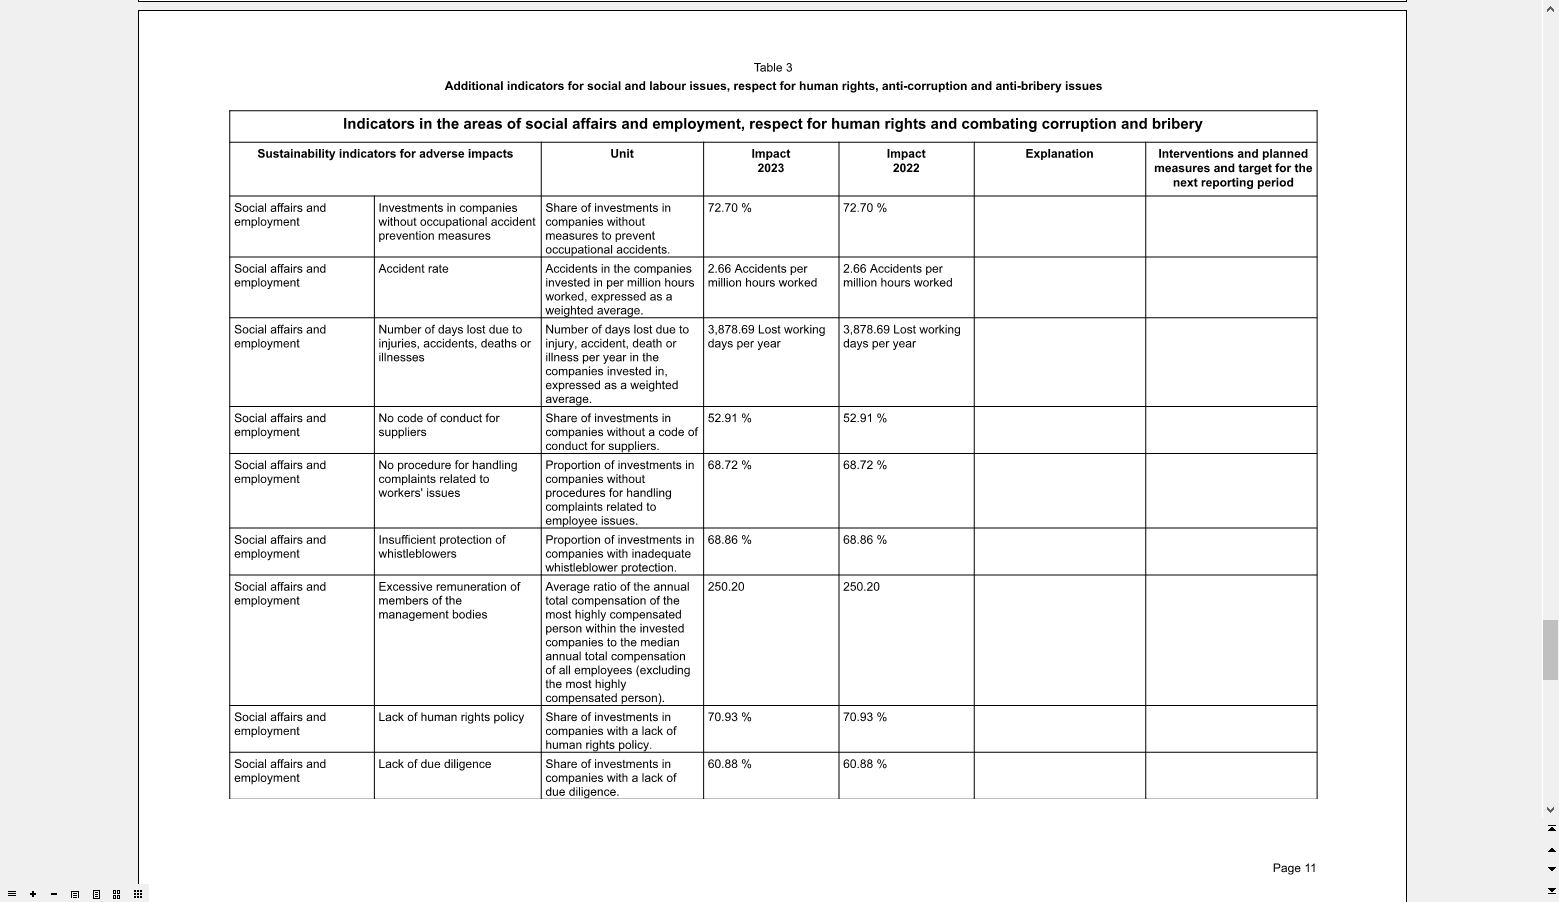
The indicators listed here can also be found in the following Table 3 "Additional indicators for social and labor issues, respect for human rights, anti-corruption and anti-bribery matters". You can show and hide the indicators using the T3 parameters of the report . Please note that you must list at least one of the indicators available in this category. - Description of the strategies for identifying and weighting the main adverse impacts on sustainability factors [Article 7 information]
- Participation policy [information pursuant to Article 8]
- Reference to internationally recognized standards [information referred to in Article 9]
- Historical comparison [information pursuant to Article 10]
Table 2 - Additional climate and other environment-related indicators
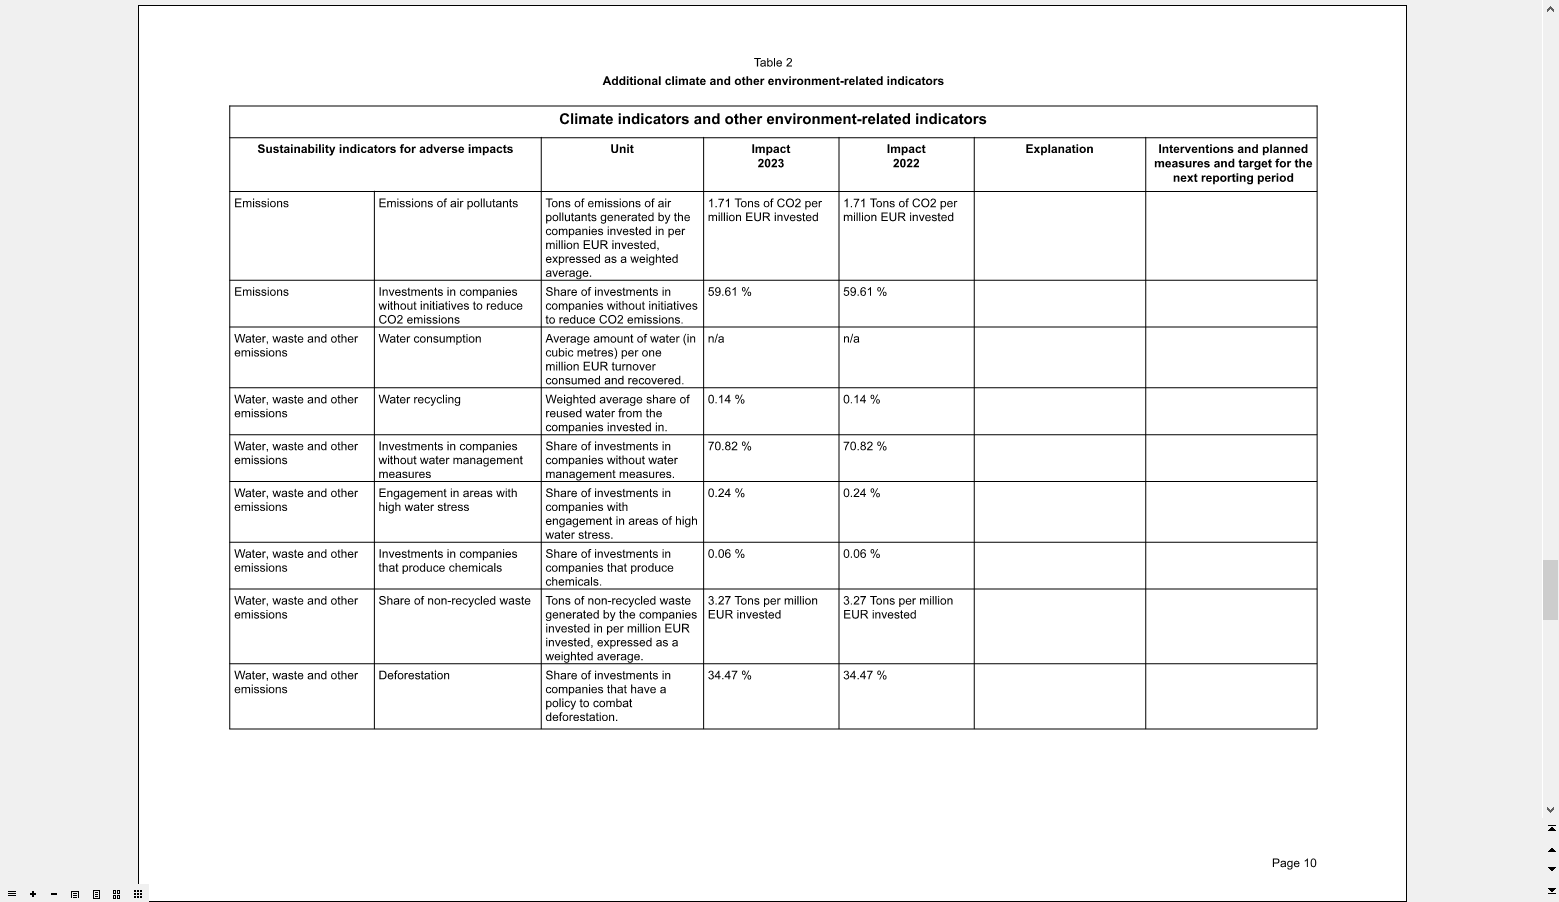
Table 3 - Additional indicators for social and labor issues, respect for human rights, anti-corruption and anti-bribery matters
The standard columns of the tables in the report in detail:
| Column | Description |
|---|---|
| Sustainability indicators for adverse impacts | This first standard column is divided into two columns:
|
| Measured variable | In this column you will find the respective measure for the indicator, e.g. for the indicator "Water consumption" the measure "Average amount of water (in cubic meters) consumed and recovered per million EUR turnover." |
| Effects current year | Here you can see the effects of the respective indicator in the current year on the portfolio values. The figures in the respective units are calculated on the basis of the securities (and their market value) in the portfolio. The entry "n. A." may stand for "no information". |
| Effects of previous year | Here you can see the impact of each indicator on the portfolio over the past year. The figures in the respective units are calculated on the basis of the securities (and their market value) in the portfolio. The entry "n. A." may stand for "no information". |
| Explanation | This column can contain your explanation of the indicator if configured accordingly. |
Interventions and planned Measures and Goal for the next Reporting period | In the last column, you can present your available information for reducing the adverse impact and the target for the next reporting period. |