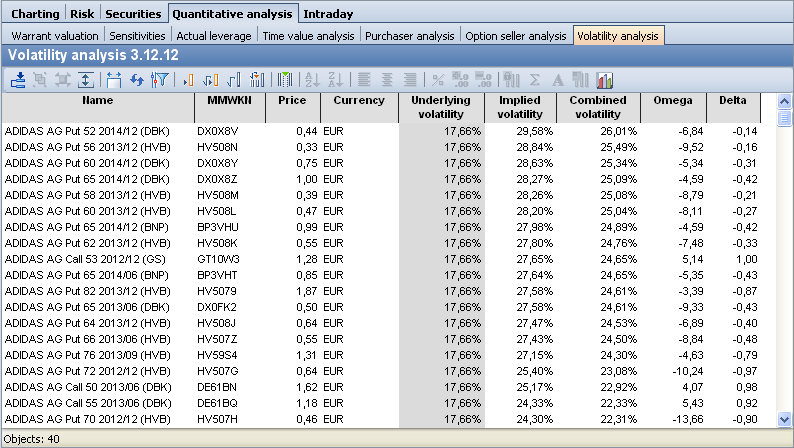
The volatility analysis compiles the various volatility figures.
The details of the individual columns:
|
Column |
Description |
|---|---|
|
Name |
The name of the option or warrant. |
|
MMWKN |
The MMWKN of the option or warrant. |
|
Course |
The course on the specified date. |
|
Currency |
The exchange rate is quoted in this currency. |
|
Base volatility |
The volatility of the underlying asset over the specified period. |
|
Implied volatility |
The volatility that the market actually accords a security. Assuming that the actual price is identical to the fair price, it is possible to calculate the volatility that should be applied to this price. This is referred to as implied volatility. |
|
Combined volatility |
The combined volatility is calculated as the weighted average of the base volatility and the implied volatility. |
|
Omega |
The omega of the option or warrant. The omega indicates the percentage change in the option value assuming an underlying change of one percent. Omega is therefore a key figure that estimates the future leverage of an option. Due to the lower price, the option reacts more strongly in percentage terms than the underlying asset. |
|
Delta |
The delta shows the dependence of the option price on the strike price. If the base price rises by one euro, the option price should theoretically rise by the delta value. The delta is always between 0 and 1 for calls and between -1 and 0 for puts. For example, if an option had a delta of 0.5, the option would rise by EUR 5 if the price of the underlying rose by EUR 10. Since the option usually costs only a fraction of the underlying asset, the percentage gain on the option is much higher. Options with a delta close to 1 react almost like shares. These are usually options that are heavily in-the-money and have lost some of their speculative character. "At-the-money" calls usually have a delta of 0.5, while calls that are strongly "out-of-the-money" have very small deltas. |