Module "Advanced Technical Analysis"
Especially for testing purposes, it is important to see what a signal system, a trading system or the signals of a trend analysis have achieved in the past.
In the "Signal Performance" evaluation, the Infront Portfolio Manager calculates all signals in the period selected in the properties of the respective input object (e.g. signal system, trading system or trend analysis folder) and thus determines the performance for all activities for which buy or sell signals have been generated. If two buy or sell signals follow one another, the earlier signal is taken into account.
You can find this evaluation in the workspace of signal and trading systems as well as trend analysis folders on the "Signals" worksheet.
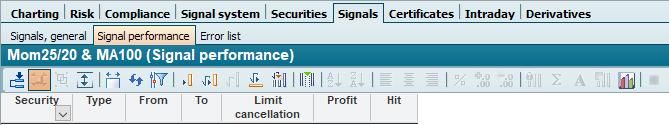
The "Signal Performance" columns in detail:
|
Column |
Description |
|---|---|
|
Securities |
The name of the respective security. |
|
Type |
The type of the respective signal. Long: Position created by the purchase of a security. Short: Position created by a short sale (sale of a security that was not previously purchased). |
|
From |
The start date of the signal phase. |
|
Until |
The end date of the signal phase. If signal phases have not yet been completed, "n/a" is displayed here after the evaluation. The price gains are then related to the current date. |
|
Limit termination |
This column returns "yes" if the phase end was set by the limit, and "no" if not. You set the limit via the signal performance parameters. |
|
Profit |
The (theoretical) percentage price gain of this signal. |
|
Hits |
This column returns "yes" for winnings above the hit win threshold and "no" for all other results. You set the hit gain threshold via the signal performance parameters. |
|
Total |
At the end, the average value of potential profits and hits is displayed for each security. |