This tab shows the utilization of certain parts of the Portfolio Manager server system. The measurement starts when the dialog window opens and remains active until the end of the program.
The measurement data is not saved.
Setting options
Various settings can be made in the upper area of the tab:
|
Field |
Description |
|---|---|
|
Period under review |
Use this selection list to select the desired viewing period in defined steps between 1 minute and 24 hours. |
|
Consolidation |
Select the desired consolidation from this selection list. This can be set between <none> and in fixed increments between 5 seconds and 15 minutes. If you activate consolidation, you can also use the "Show maximum utilization" checkbox to display the maximum utilization for the identical period. |
|
Update display |
Activated by default. To temporarily switch off the display update, deactivate this checkbox. In this case, the data will continue to be collected. When reactivated, the interface is updated with all the data collected in the background. |
|
Suspend function test |
Disabled by default. This checkbox corresponds to the one described above on the "Function check" tab. The function check is suspended by activating the checkbox. This can be helpful as the functional checks send test requests through the Portfolio Manager server at regular intervals. This can make it difficult to assess the utilization data. |
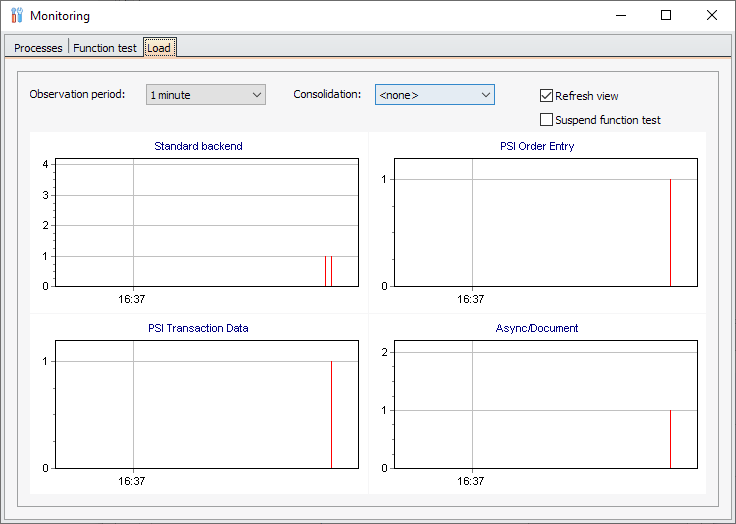
Display area
A graph is displayed for each of the backend types "Standard", "PSI Order Entry", "PSI Transaction Data" and "Async/Document". The backends of the entire server infrastructure are plotted on the vertical axis, while the horizontal axis shows the time.
In non-consolidated mode, the graph shows the current utilization of the respective backend types. A backend is occupied when it is currently answering a request. The number is added up, so only integer values are displayed in this mode.
The load visualized here does not allow any direct conclusions to be drawn about the processor load. A busy process may not be able to perform a calculation without interruption, as database queries, read and write operations to the hard disk, etc. are also being performed.
In consolidated mode, the average utilization of the backends is determined and displayed over a certain period of time. The maximum capacity utilization for this period is also (optionally) specified. This allows the average server load and certain load peaks to be visualized over a longer period of time.