Module "Advanced Technical Analysis"
A rectangle generally consists of a support line and a resistance line. The course fluctuates several times between these two lines, but without clearly leaving the channel. Normally, this is a sign of a sideways movement, which only ends when the upper or lower line is broken through.
Many smaller, short-term formations can be recognized in a relatively broad rectangle. If you are speculative, you can buy the security when it has just reached the lower line and speculate that the price will reach the upper line again.
As a conservative investor, however, you should only act when the channel has clearly left.
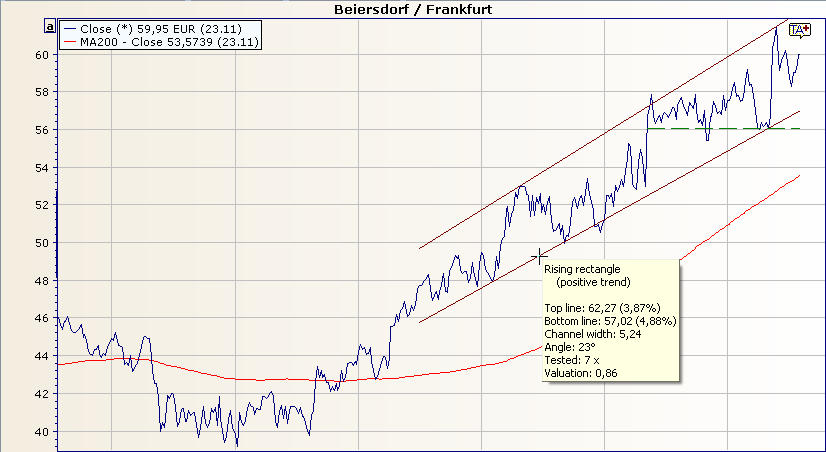
In addition to the horizontal rectangles, the rectangle can also point upwards or downwards. This is referred to as rising or falling rectangles or trend channels.
A rising rectangle generally indicates an intact upward trend. If this upward trend is broken to the downside, caution is advised. However, an upward breakout should also be treated with caution, as it is often only a short-term upswing and the movement then reverses relatively suddenly.
A falling rectangle indicates a downward trend. If this is broken upwards, this is a positive sign, but not yet a buy signal. This is only the case when a typical bull market formation has formed.