In addition to the key figures for warrants described above, the Infront Portfolio Manager can also calculate other key figures based on previous price performance. This is primarily the real leverage, which, in contrast to the calculated leverage, reflects the actual performance of the warrant in relation to the corresponding underlying asset.
You can start the analysis in the workspace of an underlying (for all warrants denominated in this underlying) or in the workspace of a folder or filter.
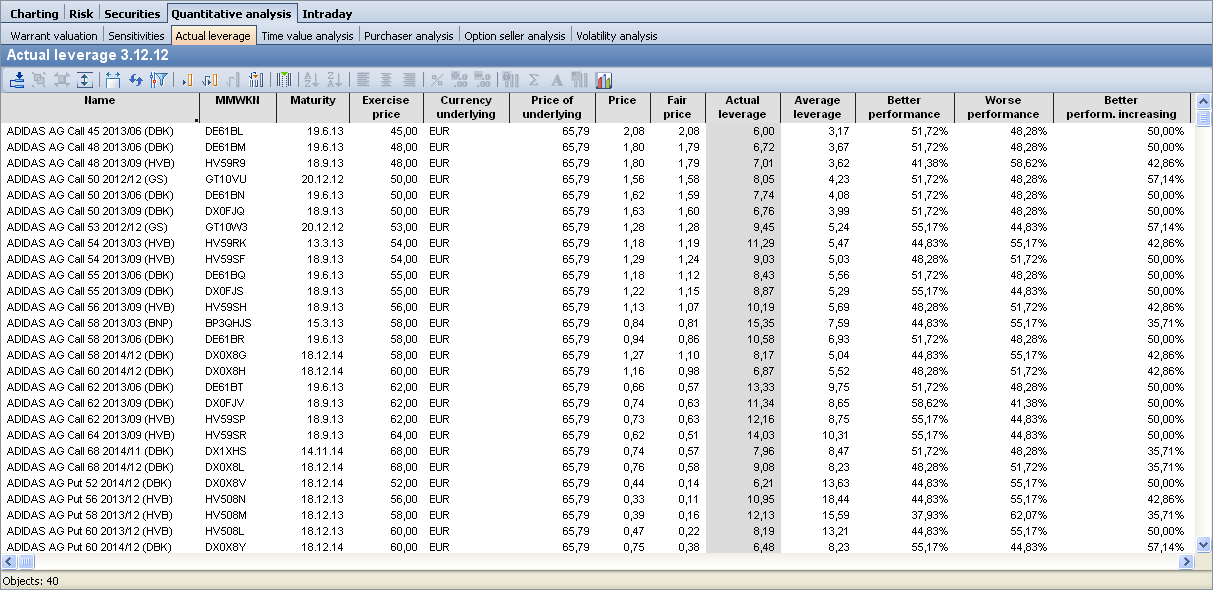
The details of the individual columns:
|
Column |
Description |
|---|---|
|
Name |
The name of the option or warrant. |
|
MMWKN |
The MMWKN of the option or warrant. |
|
Runtime |
The exact term of the option or warrant. |
|
Base price |
The price agreed upon conclusion of an option transaction at which the buyer of a warrant can resell or buy the security up to the option date (also: Strike). |
|
Currency Underlying |
Currency in which the underlying share is quoted. |
|
Underlying price |
The price of the underlying share. |
|
Course |
The course on the specified date. |
|
Fair price |
The fair price according to the Black-Scholes model is displayed here. |
|
Real leverage |
The real leverage indicates the average performance of the warrant in comparison to the underlying asset during the analysis period. If the real leverage is greater than one, this means that the warrant has outperformed the corresponding share. |
|
Medium lever |
The average of all levers in the analysis period is calculated here. Unless you modify the parameters, the analysis period is 30 trading days. |
|
Better performance |
This shows the number of days during the analysis period on which the warrant moved more in percentage terms than the share. Of course, if prices fall, this means that the warrant has also fallen more sharply. The value is displayed as a percentage of the analysis period. |
|
Poorer performance |
This shows how often the warrant has underperformed the share. |
|
Better performance increasing |
A further distinction is made here as to how the warrant has changed with rising and falling prices of the underlying asset. This enables you to recognize whether this warrant has perhaps only participated disproportionately in these movements when prices are falling, or whether it has also shown the corresponding performance when prices are rising. The column shows how often the warrant has risen more in percentage terms when share prices have risen. |
|
Poorer performance falling |
This shows how often the warrant has fallen more in percentage terms when share prices have fallen. |
|
Break-Even |
The break-even indicates the minimum or maximum price that the underlying asset must reach on the warrant's maturity date in order for the buyer of the warrant to make a profit by exercising it. |
|
Premium |
The current premium, which you can immediately compare with the average premium. |
|
Medium premium |
As with the real leverage, the average premium (premium) during the analysis period is displayed here. |
|
Change in premium |
Change in the current premium compared to the average premium. You can sort the table by this column, for example, and quickly see which warrant has reduced the most premium. You sort the table by a column by double-clicking on the column heading. |
|
Security no. |
The security number of the security. |
|
WKN |
The security identification number of the security. |
Details on special parameters of the real lever:
|
Parameters |
Description |
|---|---|
|
Period (days) |
Here you enter the period over which the price developments are to be compared (in days). The period is also the basis for calculating the volatility for the "fair price". You can use the arrow keys to change the period, or you can select the period with the mouse and enter a different number of days. |
If you do not make any changes or entries, the default settings are automatically used.