The ranking list is a table that lists all securities of the input object (e.g. a folder or filter from the Explorer). The securities are sorted according to their percentage price difference compared to the previous day, i.e. the security with the largest price increase in percent compared to the previous day (or the last trading day) (or the smallest price loss in percent if all are in the red) is at the top.
You can find the ranking list in open workspaces (e.g. folders or filters) on the "Securities" worksheet.
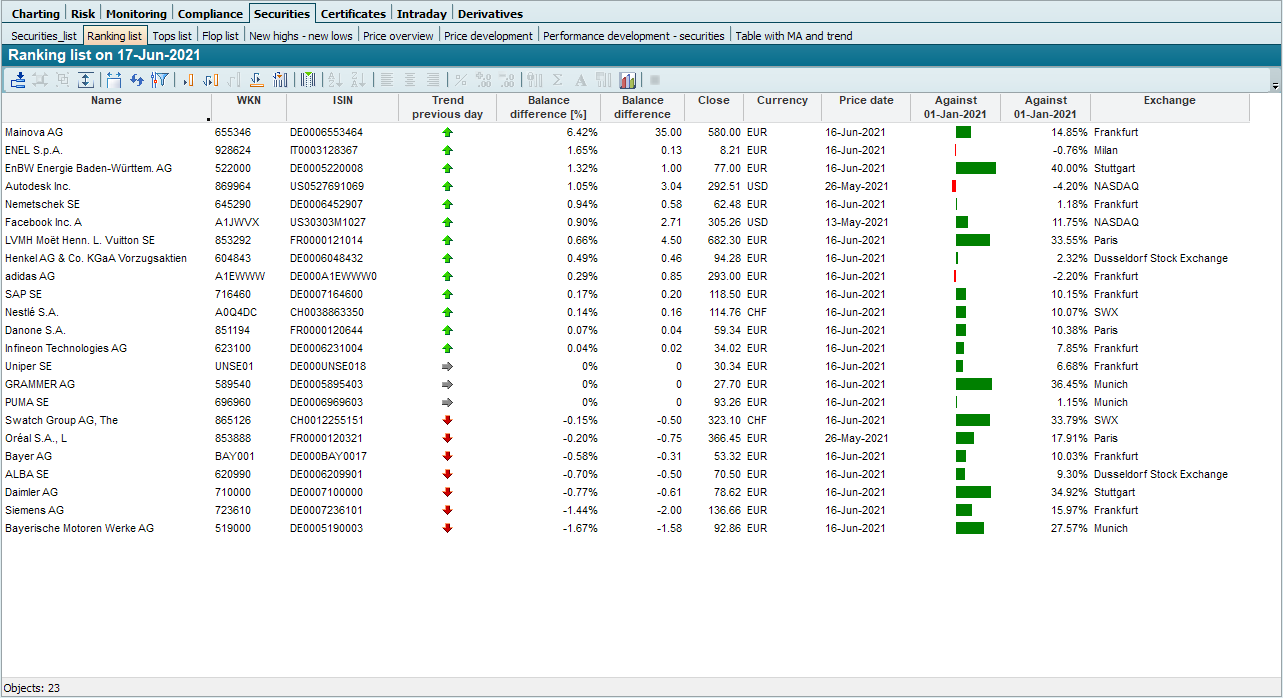
In addition to the difference to the previous day, the ranking list also shows the development compared to the beginning of the year. The columns with arrows and bars show you the winners and losers at a glance. Double-click on a column heading to sort the table by this column.
Ranking list parameters
![]()
The ranking list has the following parameters:
|
Parameters |
Description |
|---|---|
|
Evaluation date |
Evaluation date of the evaluation, which you can enter in the form "dd.mm.yy". The default setting is the current date or the evaluation date entered in the input field on the "Start" tab. |
|
Reference date |
Enter the date to which the percentage changes and the bar charts refer. The default setting is January 1 of the current year. |
|
Consider corporate actions |
Use this checkbox to specify whether any corporate actions should be included. Activated by default (analogous to Chart Standard, for example). |
|
Consider dividends |
Use this checkbox to specify whether any dividend payments should be included. Deactivated by default (analogous to Chart Standard, for example). |