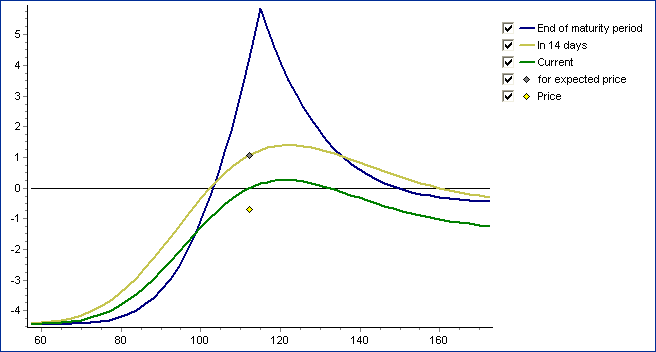
The diagram above shows three profit-loss graphs containing simulated prices at different points in time. The basic course is varied.
-
Profit/loss at the end of the term: If all options in the strategy have the same term, this curve corresponds to the course of the intrinsic value (less investment). Volatility and interest rates are based on market expectations.
-
Profit/loss at the expected date: Here too, volatility and interest rates are based on market expectations.
-
Profit/loss at the current time: The profit/loss curve at the current point in time is also displayed for comparison. Volatility and interest rates are based on the current values.
Two points are marked next to the curves:
-
The current price of the strategy; this should be close to the simulated prices.
-
The point on the expectation graph that corresponds to the expected profit.