Module "Advanced Technical Analysis"
Proceed as follows to display the performance history of a trading system in the chart:
-
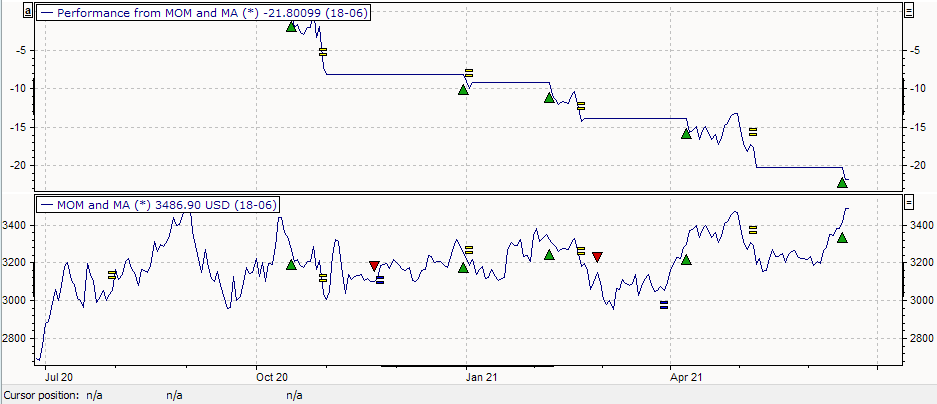
Mark the course of the trading or signal system in the chart window.
-

The performance of the trading system is calculated and displayed in the chart window.
To display the performance of the system in tabular form for all input objects, switch to the "Signals" worksheet in the trading system workspace and then to "Signal performance".