Module "Advanced Technical Analysis"
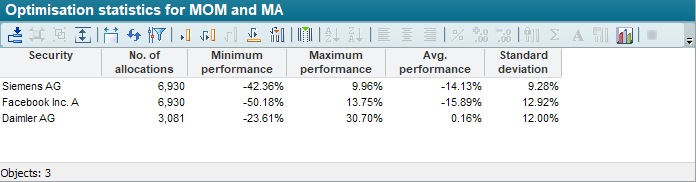
After or during the optimization, statistics can be evaluated for the optimization. Each optimized security is displayed.
In the workspace of the trading system, switch to the "Optimization" tab and then to "Optimization statistics".
|
Column |
Description |
|---|---|
|
Securities |
The name of the security. |
|
Number of occupancies |
The number of occupancies that were examined. |
|
Minimum performance |
The minimum performance value found for the security. |
|
Maximum performance |
The maximum performance value found for the security. |
|
Average performance |
The average of all performance values for the security. |
|
Standard deviation |
The standard deviation for all performance values. |
Double-click on a table row to display the frequency distribution for all performance values of the relevant security in graphical form.
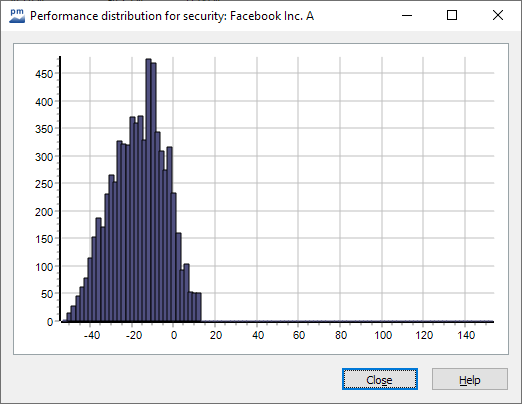
![]()
You can call up the optimization statistics while optimization is running. You can repeatedly update the display using the "Re-evaluate" icon in the quick access toolbar or <F8>.