To change colors, you can access the dialog window familiar from Windows at various points in your Infront Portfolio Manager.
Examples:
-

-
Double-click on a time series in the chart. In the "Time series properties" dialog box that appears, click on "Color" on the "Display" tab.
-
Select the BACKGROUND... command in the context menu of chart windows to specify the colors in the "Edit background" dialog box that appears.
-

-
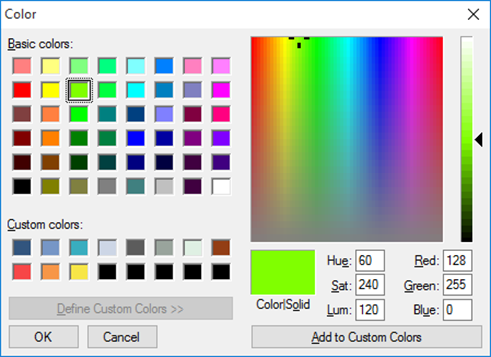
Select the desired colors with a mouse click.
-
Select the "Define colors" button if you want to create an individual color. The color scale is expanded and you can define colors.
-
Select the "Add colors" button. The edited color is added to the "Custom colors" list.
-
Select the newly defined color in the "User-defined colors" field and confirm with "OK".