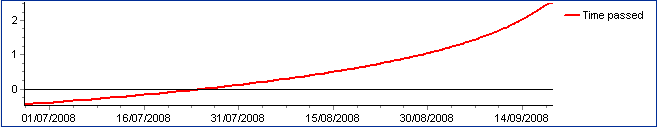
The diagram below shows the simulated profit/loss curve for the market expectation over time from the current date to the end of the term. Here you can read when the main value jumps in a strategy occur, especially in strategies with a time effect such as time spreads.