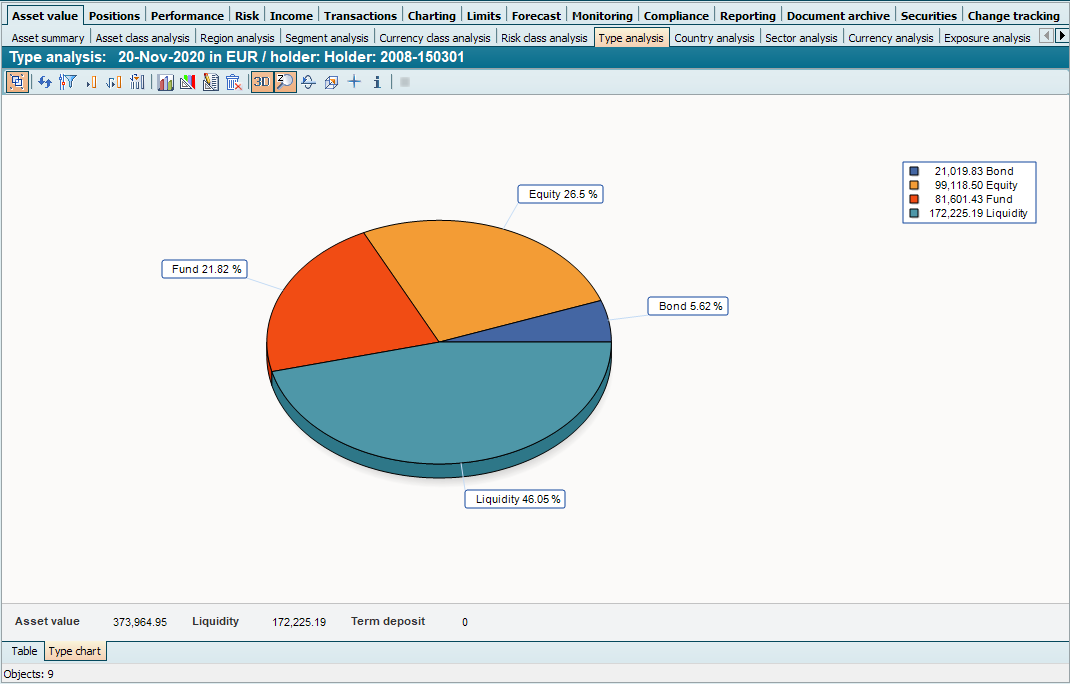
The species analysis opens as a table. Select the "Species diagrams" tab at the bottom of the window in the work area to switch to the diagram display.
The pie chart shows the value share of the individual portfolio items grouped by type as well as the share of liquidity in assets. Any existing loans with negative values are also included here.
Information on editing this display can be found in the chapter Diagrams.