Drawing functions
When you open a chart, you will find the drawing functions on the right-hand side of the chart window. The symbols (icons) of the drawing functions are clearly arranged and easily accessible.
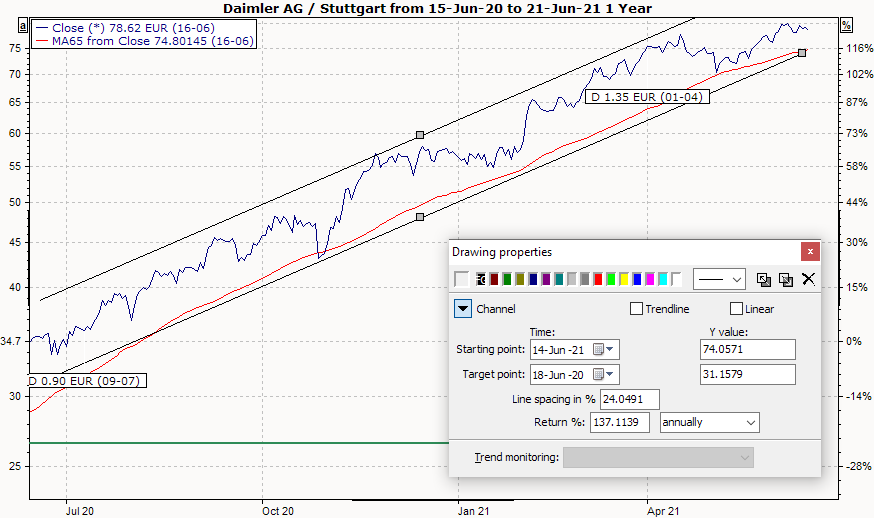
In addition to the technical indicators, your own trend lines, texts etc. are indispensable for chart analysis. The Infront Portfolio Manager offers many different drawing functions with which you can draw your own trend lines, formations or texts in the chart.
Texts and drawings are always saved relative to the course. They begin with the date on which they were originally entered. When a different time period is displayed, the drawings or texts are no longer visible but are still saved.
You can draw as many drawings as you like in the open chart or in an indicator window.
Chart drawings are always associated with price quotations (and templates). If a security object is displayed in the chart, the drawings of the (standard) valuation price quotation are displayed and changed.
Side effect: If the (default) valuation place of a security object changes, other or possibly no subscriptions appear for the security object.
Siehe auch: